Economico Marketplace 3a & FZG Securities Solutions: Performance comparison
Flash #54, December 11, 2025
As investors, we want the highest possible returns with the lowest possible risk. This is no different when it comes to securities savings within pillar 3a or as part of vested benefits. That is why we analyze and compare the performance figures submitted by providers with the utmost care in the Economico marketplace.
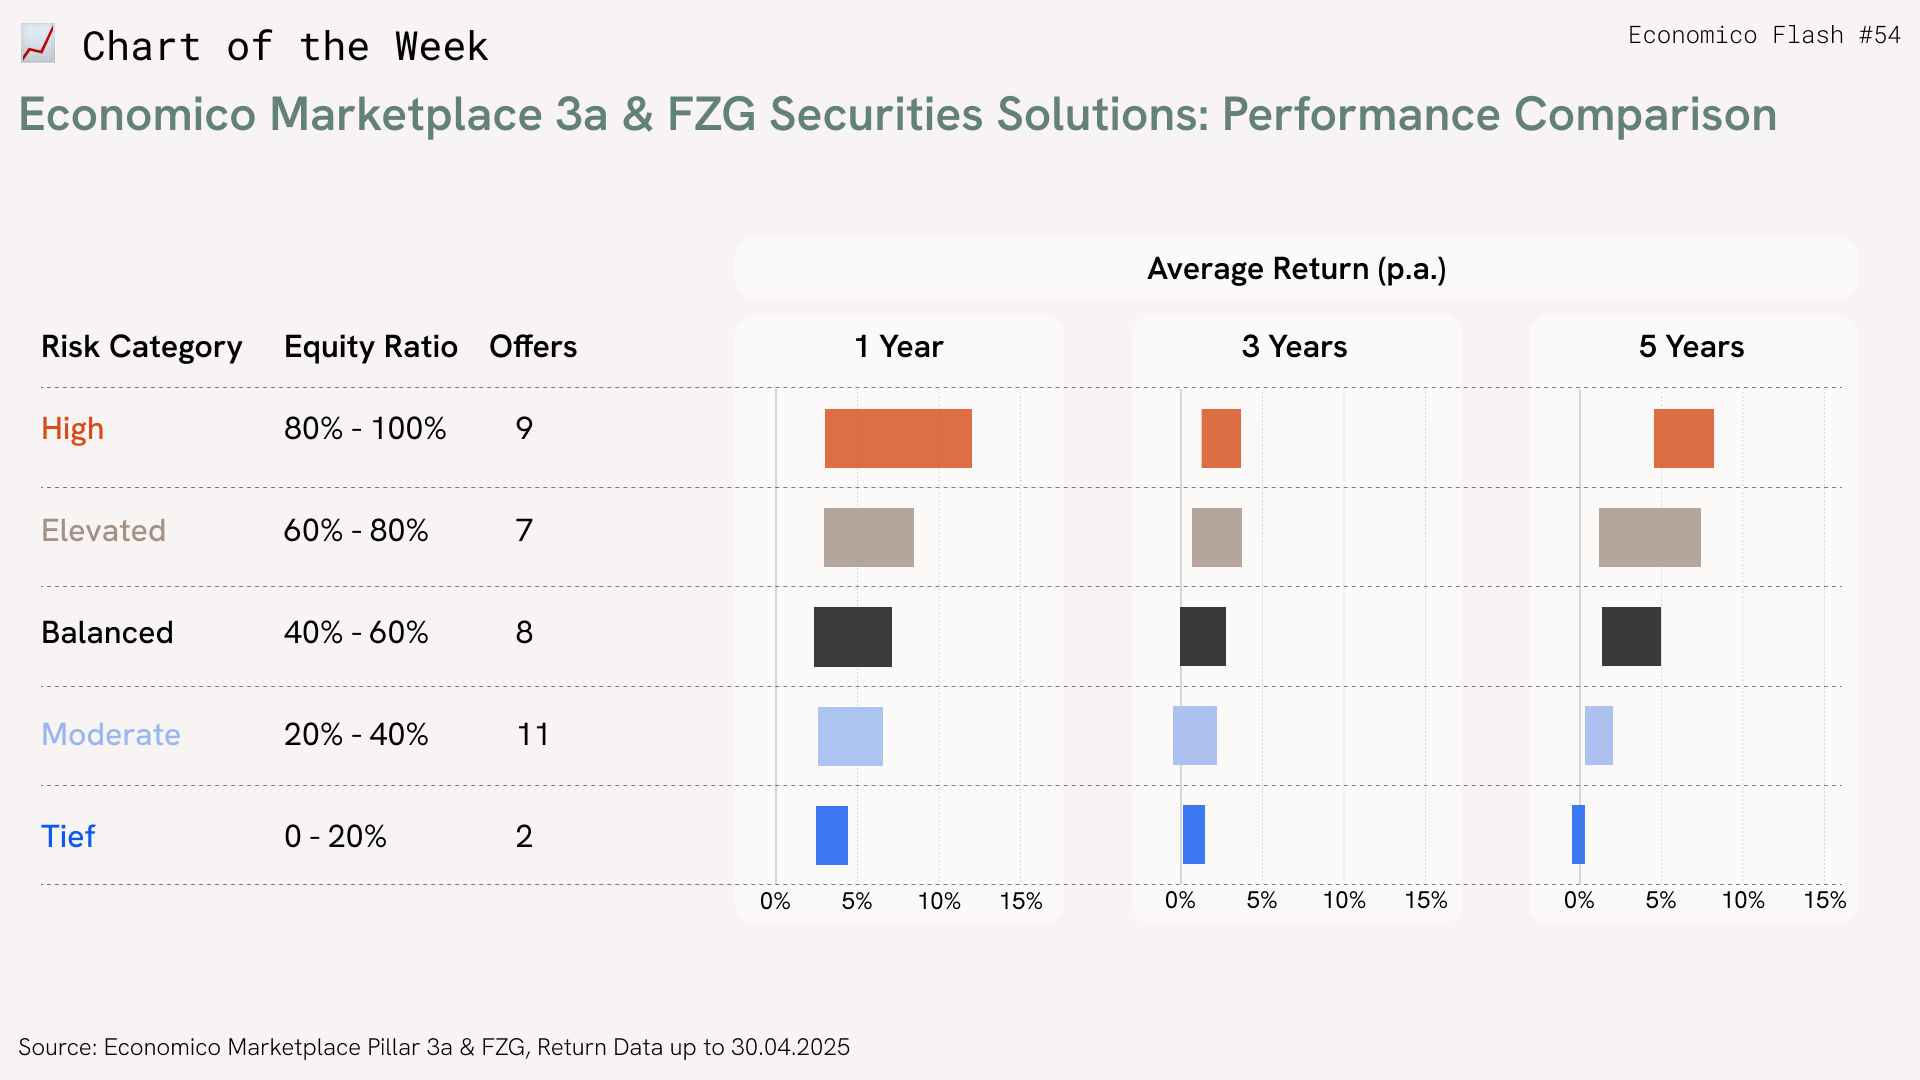
In order to enable meaningful performance comparisons of the 3a and FZ offers submitted, we first assign each product to one of five risk classes.
The chart of the week shows the performance intervals within a risk class between the highest-yielding and lowest-yielding products for three different time periods (1 year, 3 years, 5 years).
The 3-year comparison and, above all, the 5-year comparison show that the truism “more risk (in the form of a higher equity allocation) brings higher returns” has also been true in the recent past – despite significant dips in the capital markets as a result of the coronavirus and Ukraine crises.
Just as important as the performance figures themselves is the assessment of their data quality. At Economico Marketplace, we distinguish between three types of data quality and illustrate these in three different colors:
- Effective and revised track records: With some 3a and FZ providers, you invest directly in a single fund. The performance figures achieved by the fund in the past are published and independently audited. This corresponds to the best possible data quality, which we mark with a green bar in Economico.
- Performance model portfolio: With other providers, each individual mandate is implemented individually based on your preferences. These providers calculate performance figures based on defined model strategies. However, these are not actual portfolio results. In Economico, we mark these products with a blue bar.
- Simulated performance: No performance history is yet available for newly launched investment products. The performance figures provided by the provider correspond to a simulation or a so-called backtest. In Economico, we mark these products with an orange bar.
You now have all the essential information you need to form your own differentiated view of the performance figures presented on the Economico marketplace.
Takeaways
- Of course, the return is a decisive assessment criterion.
- However, always read the fine print when looking at return figures.
Takeaways
- Of course, the return is a decisive assessment criterion.
- However, always read the fine print when looking at return figures.